On November 15th, the U.S. Department of Agriculture (USDA) released an updated 2023 Plant Hardiness Zone Map (PHZM), jointly developed by USDA’s Agricultural Research Service (ARS) and Oregon State University’s PRISM Climate Group. This version replaced the 2012 map, long used as the go-to resource used by gardeners, farmers, seed companies, nurseries and plant breeders to determine what species and varieties will thrive in their region. It is more accurate than any PHZM before it, incorporating data from 13,412 weather stations compared to the 7,983 used for the 2012 map. The resolution is now also much more refined than 2012: from a 6 ¼ square mile area of detail down to a ¼ square mile.
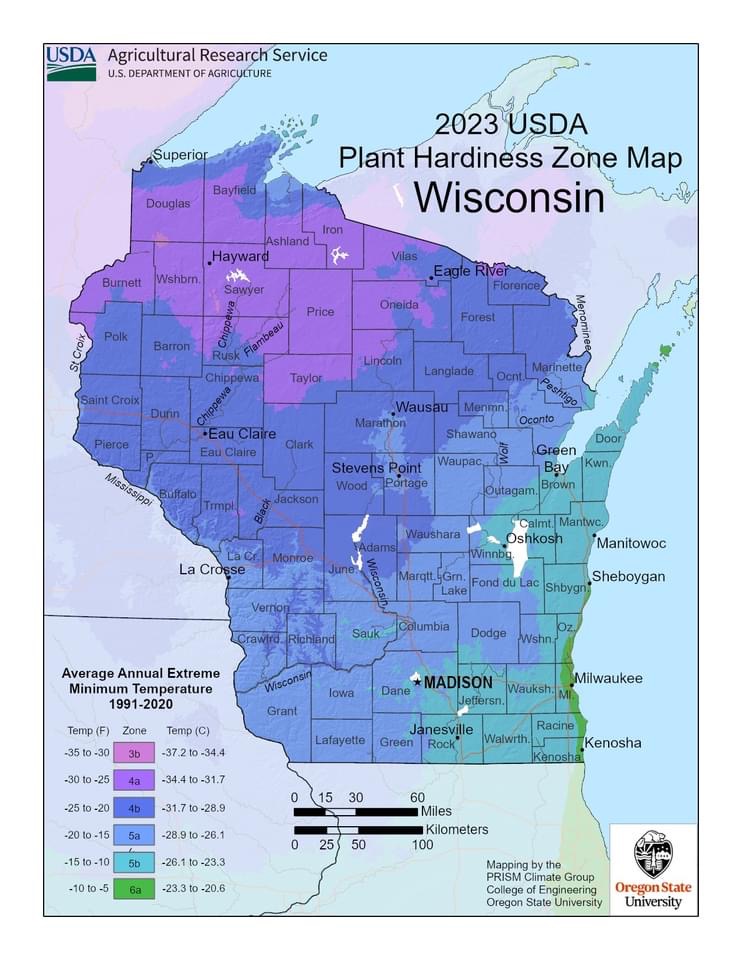
The release of this new version created quite a stir in Wisconsin. The updated maps confirmed what many avid gardeners have already observed: our climate is changing. That means what we can grow, and where we can grow it, has changed too. Specifically, 2023’s PHZM revealed that for the first time in recorded history, Wisconsin now has a sliver of Zone 6a (minimum temperature of –10° to –5° F) along the southeastern coastline between Sheboygan, through Milwaukee, and south into Kenosha.
Additionally, the northwestern part of Wisconsin (counties surrounding Hayward) has warmed as well. In the 2012 maps, that area had a zone 3b (-35° to –30° degrees F) extending north of Douglas and down into Taylor counties, the 2023 PHZM reveals that now there are only small pockets of Zone 3b, and much of that area is now solidly in Zone 4a (-30° to –25° degrees F). Madison, once in the heart of Zone 5a (-20° to -15° F), is now mostly Zone 5b (-15° to -10° F).
To understand the proper use and limitations of these maps we must understand that looking at PHZMs is like looking into a rearview mirror. The 2023 map reflects the average annual lowest temperature from the previous 30-years recorded at specific locations throughout the state. While Wisconsin shifting into Zone 6a is big news for our state, statistically we’ve been in Zone 6a during the past 10 years. While the accuracy for 2023 is assured, with each subsequent year and continued change in climate conditions, the PHZMs become less and less accurate. Additionally, PHZMs do not take into account extreme temperature fluctuations that can wipe out crops or prized garden specimens. Nor do they reflect the expected climate changes coming to our state.
Why does this matter? Besides the millions of avid gardeners and farmers who rely on these maps for planting plans and financial decisions, many others use this hardiness zone information too. For example, the USDA Risk Management Agency uses the USDA plant hardiness zone designations to set some crop insurance standards. Scientists use the plant hardiness zones as a data layer in many research models such as those analyzing the spread of exotic weeds and insects. Additionally, USDA’s chief scientific research agency, ARS, uses Plant Hardiness Zone Maps as a tool to ensure food safety and quality, sustain a competitive agricultural economy, assess the nutritional needs of Americans, enhance the natural resource base and provide economic opportunities for rural citizens and other communities.
Because this tool is based on 30-year historical data in a rapidly changing climate, it is not the most robust tool for such important, wide-reaching decisions. This can have significant financial implications for farmers relying upon crop insurance if weather patterns and associated outbreaks of pests and diseases exceed PHZM averages. If ARS is truly to lead America towards a better future through agricultural research and information, we need to know both current and future projected crop suitability ranges to ensure that our food system is not just surviving but thriving.
In response to this need, Clean Wisconsin’s Natural Climate Solutions (NCS) initiative has been working in collaboration with the Wisconsin Initiative on Climate Change Impacts (WICCI) and the University of Wisconsin-Madison’s Department of Atmospheric and Oceanic Sciences to scale future temperature and precipitation projections for Wisconsin down to the county level. When paired with historical averages, including the 2023 Plant Hardiness Zones and other baseline data, we will be able to map both current crop suitability for Wisconsin’s top agricultural commodities and future projected crop suitability. This will help us better understand the place-based risks to our food systems and agricultural economy. Additionally, we are mapping current and future projected crop suitability for over 30 high-value perennial crops that have shown great promise as natural climate solutions. These maps will be used to inform practical policy and supply chain development recommendations to help our farmers and state transition to a net-zero economy and ensure a thriving food system into the future. Stay tuned for more!
